javascript - vue-echarts-v3使用的過程中折線圖區域呈漸變色。
問題描述
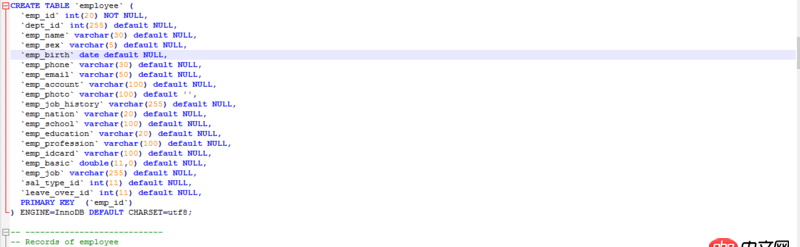
這是我的圖表數據
我希望紅色部分是漸變色。我已經使用了visvisualMap的方法,并不能達到我想要的效果。當我使用new echarts.graphic.LinearGradient(0, 0, 0, 1, [{
offset: 0, color: ’rgb(255, 158, 68)’}, { offset: 1, color: ’rgb(255, 70, 131)’}])。。。我找到的其中一種方法,。。但是不知道怎么獲取echarts對象,
由于不想在項目中引入過多的資源,所以引入zRender暫時不在考慮范圍之內。。。 求助希望解決vue-echarts-v3插件使用是,獲取new echarts.graphic.LinearGradient()的辦法
<IEcharts :option='bar' class='step_echarts'></IEcharts
import IEcharts from ’vue-echarts-v3’import ’echarts/lib/chart/line’
export defalut{data(){
return{ bar: { tooltip: {}, xAxis: {data: [’1泡’, ’2泡’, ’3泡’, ’4泡’, ’5泡’],axisTick:{ alignWithLabel:true} }, yAxis: {show:false }, series: [{name: ’Clouds’,type: ’line’,data: [5, 7, 13, 20, 30],areaStyle: {normal:{}} }]} }}
}}
問題解答
回答1:我隨便寫了三個顏色。
series: [{name: ’Clouds’,type: ’line’,data: [5, 7, 13, 20, 30],areaStyle: {normal:{}},itemStyle: {normal: { color: new echarts.graphic.LinearGradient(0, 0, 0, 1,[ {offset: 0, color: ’red’}, {offset: 0.5, color: ’pink’}, {offset: 1, color: ’#ddd’}] )} }}]

樓上說的對,你要想要漸變,你就要給他設置圖例,告訴它從哪漸變到哪,要不然用的是默認的顏色
相關文章:
1. android-studio - Android Studio 運行項目的時候一堆警告,跑步起來!?2. dockerfile - [docker build image失敗- npm install]3. mysql - 新浪微博中的關注功能是如何設計表結構的?4. angular.js使用$resource服務把數據存入mongodb的問題。5. 如何解決Centos下Docker服務啟動無響應,且輸入docker命令無響應?6. angular.js - 關于$apply()7. MySQL數據庫中文亂碼的原因8. 表單提交驗證,沒反應,求老師指點9. nignx - docker內nginx 80端口被占用10. angular.js - Ionic 集成crosswalk后生成的apk在android4.4.2上安裝失敗???
 網公網安備
網公網安備